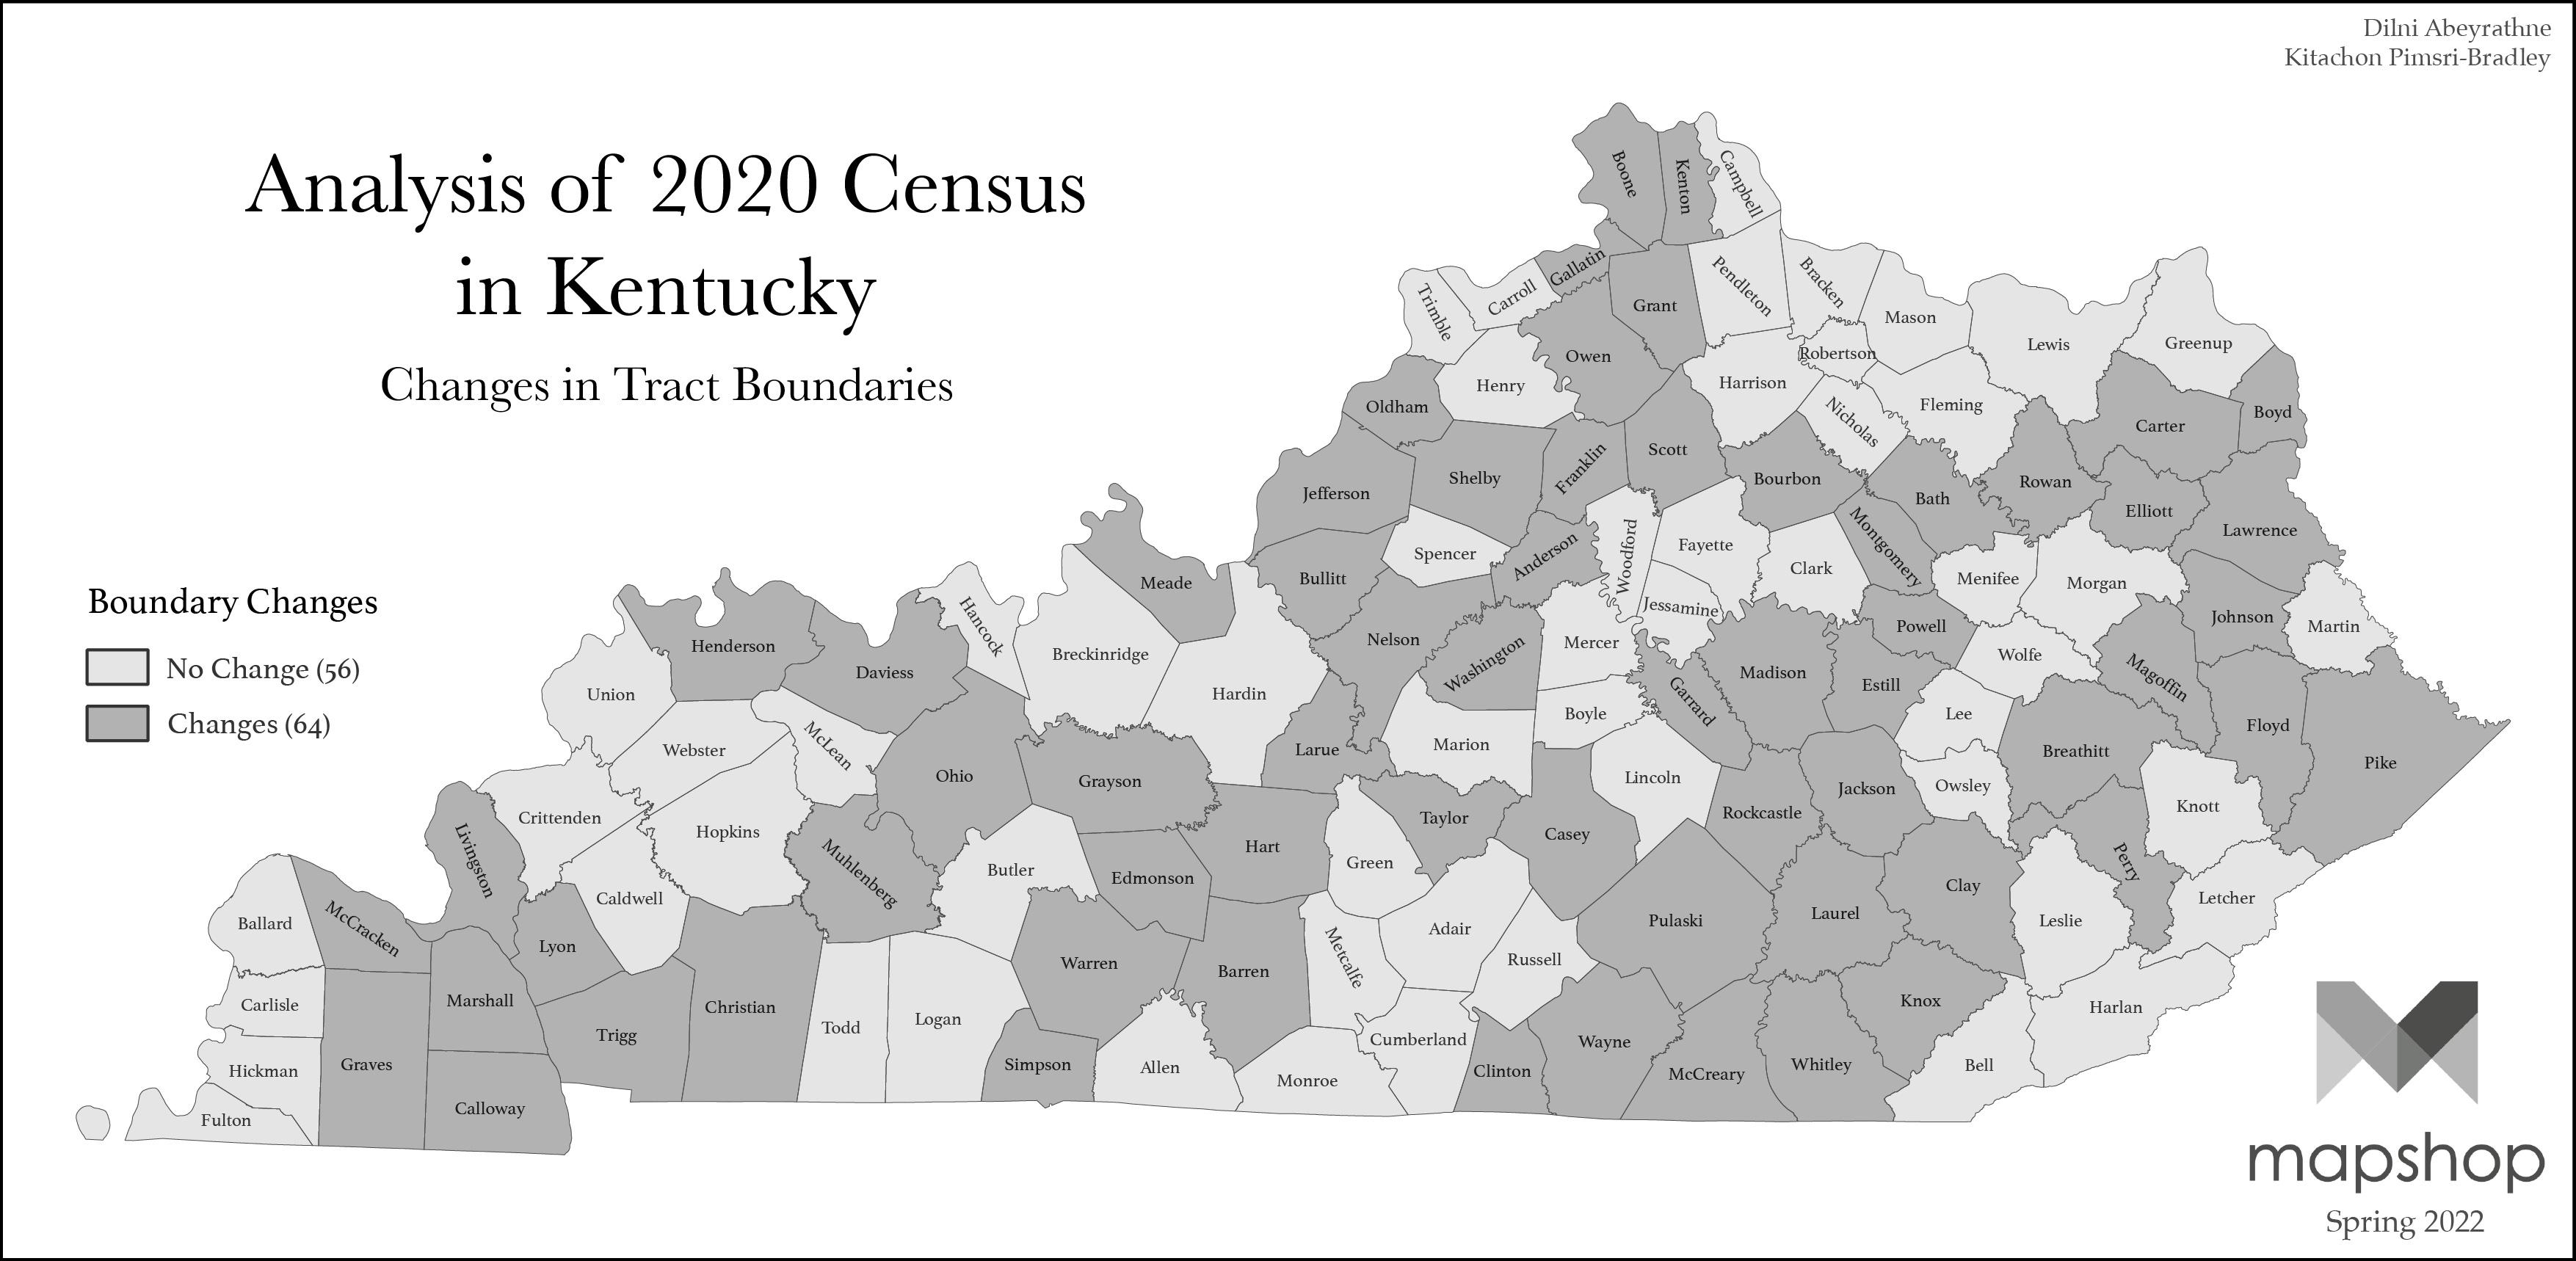
In the Fall of 2021, Mapshop began to analyze the data released in the 2020 Census for Kentucky. In addition to urban scale analyses in places like Louisville and Lexington, we are also analyzing broad changes across the 120 counties in the commonwealth. We envisioned this work in two broad phases: (1) analysis of the changes in geometries (boundaries) between census tracts in 2010 and 2020 and (2) analysis of demographic changes that accounts for these changes in enumeration boundaries.
Analysis of boundary changes
The data used to create the above map included the 2010 and 2020 tracts in Kentucky downloaded from the US Census Data website. Analysis for this map compared tracts in 2020 to tracts in 2010 and noted changes in tract boundaries (including tract divisions and mergers). A new file consisting only of 2010 and 2020 Kentucky census tracts was created for further examination. For example, Tract 1400000US21005950100 in Anderson County (2010) split into Tracts 1400000US21005950101 and 1400000US21005950102 in 2020. Additionally, it appeared that some tracts disappeared while the new tracts neglected to follow established order. For example, the absence of Tracts 1400000US21015070307 and 1400000US21015070308 was replaced by Tracts 1400000US21015070315, 1400000US21015070316, 1400000US21015070317 and 1400000US21015070318, which raises further questions about the census tract naming system. Another analysis was then performed examining counties with and without changes using the previous analysis, where we were able to identify the geographical location of the changes and their corresponding counties. Each county was delineated as either 1 (no change) or 2 (change) to reflect their status for mapping purposes. For both, full GEOIDs were used for ease of analysis and ease of incorporating them into QGIS.


